

Microsoft has made a new free analytics tool that allows us to perform an analysis of a website, study the behavior of users visiting it and related statistics. This tool is called Microsoft Clarity, a resource with very interesting features and easy to use that helps us gather useful information to allow us to improve the navigability, interaction, operation and performance of a website or e-commerce.
What is Microsoft Clarity?
While similar in some respects to Google Analytics and perhaps more like Yandex Metrica in others, Microsoft’s monitoring tool is designed to be used even by novice users. The main features offered, by this tool, are:
- Dashboard for an overview of user performance and behavior
- Session logging that notes the behavior of visitors to your website
- Heat map that allows you to observe, in a precise way, the different movements and where visitors click the most
Importantly, thanks to its careful optimization, it does not slow down page loading on sites where it is used. In addition, it has no traffic limit: even sites with large influx of visitors can use it for free.
Clarity uses real evidence but does so while respecting user privacy and GDPR.
How Microsoft Clarity works
To use and make Clarity active, it is necessary, first of all, to register and create a project. Next, simply click on the “Start” button, and as soon as you sign up, a dashboard will appear with a popup asking you to enter a new project, the URL of your website, and choose a site category.
Next, you will have to enter a monitoring code inside the tag of a site, e-commerce or app that you want to analyze. You can also install the code using third-party platforms such as Google Tag Manager.
In addition, Clarity offers the ability to integrate data derived from Google Analytics by simply connecting your Google account.
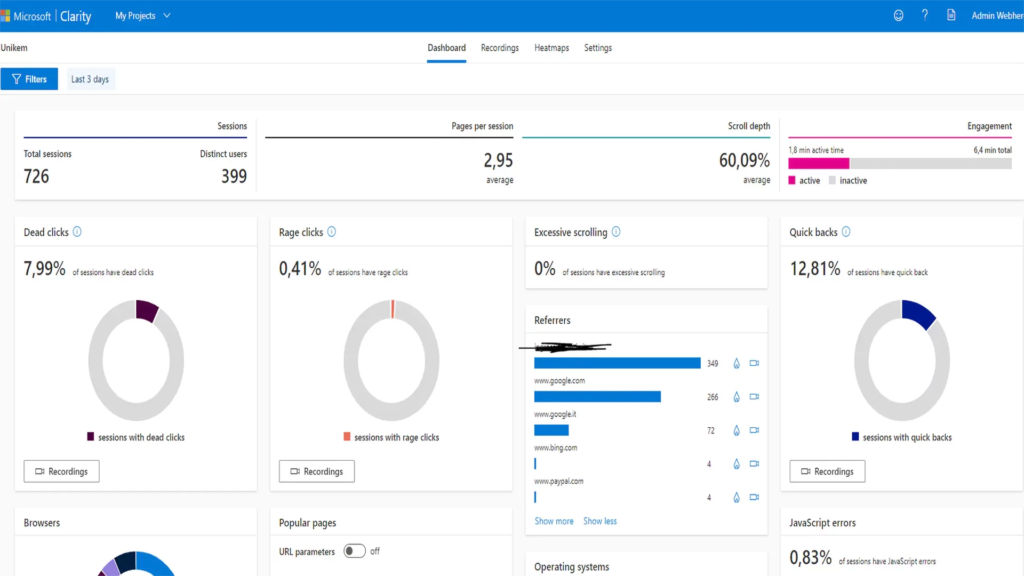
Dashboard
This section is well structured and easy to understand. It is designed to provide a single set of information, and each metric is juxtaposed with a quick explanation. This approach is very useful for those users who come from other monitoring tools and are unfamiliar with the new entries:
- Rage clicks When a small section of a page is clicked on continuously. This indicates a certain nervous state of the user;
- Dead clicks A visitor clicks idly on a page and gets no results;
- Excessive scrolling A lot of scrolling is done within the page, as if to quickly scroll through the page without getting a chance to see anything.
Eliminating these issues and knowing the most interesting user sessions allows you to make important decisions that serve to simplify the design and optimize the user experience of your site, improving the conversion rate.
Recording Panel
This tool allows users’ sessions and behavior to be recorded as they use the page. The data that are highlighted are:
- the duration;
- the number of pages visited;;
- the number of clicks made;
- the device and operating system used;
- the country of origin.
The navigation video faithfully reflects what the user viewed. The only exceptions are mouse movement from desktops and touches on the screen from smartphones. Convenient filters can be used to make it easier to find a session.


+ There are no comments
Add yours