


What is Yandex Metrica?
Yandex Metrica is an online tool produced by Yandex made to analyze user behavior. It is a tool that allows you to refine the analysis of information related to site behavior. Thanks to such data it is possible to increase the conversion capacity and therefore the sales of the website.
The tool is available in English, Russian, Ukrainian and Turkish languages.
Why use Yandex Metrica?
Why use Yandex Metrica when you already have Google Analytics available? Primarily because it can offer more specific information regarding the behavior of users on the site and those factors that reveal their liking or disliking. Thanks to this platform we can analyze the clicks performed on the portal, go into detail about traffic and behavior, and extract the information in the form of convenient customized reports in PDF, Excel or CSV.
A great advantage is the ability to segment traffic at the level of devices, type of users, source of visits, etc. – to obtain important data for site evaluation. For example, we can identify where users’ attention is most focused, to place call-to-actions with greater effect.
The benefits of Yandex Metrics
- Allows you to analyze traffic by geography and sources
- Ability to obtain very accurate traffic data
- Allows you to understand behavior on each area of the site and identify the areas that attract the most attention
- Helps to understand what length is most appropriate for a page
- Helps identify phenomena behind interruptions in the buying process
- Allows you to create easily customizable reports
How to use Yandex Metrics?
To use the tool, as with Google Analytics, we need to create an account copy the code within the site. If we have a WordPress site we can make use of the appropriate plugin.
Keep in mind that the Yandex code must be installed on all pages that you intend to monitor. Otherwise they will be shown in the navigation as empty.
Also thanks to Google Tag Manager you can implement Yandex on your site via a simple portion of custom HTML code.
From Yandex then you will need to create a new counter from the Add Counter item and enter the required information:
- Counter name
- Website domain
- Time zone and currency
- Session duration
- Accept the terms of use and then click “Create Counter”.
You can also set advanced collection and editing filters. The counter has a yellow or red circle. When properly installed it will change to green color.
When you are ready, you can try Yandex Metrica.
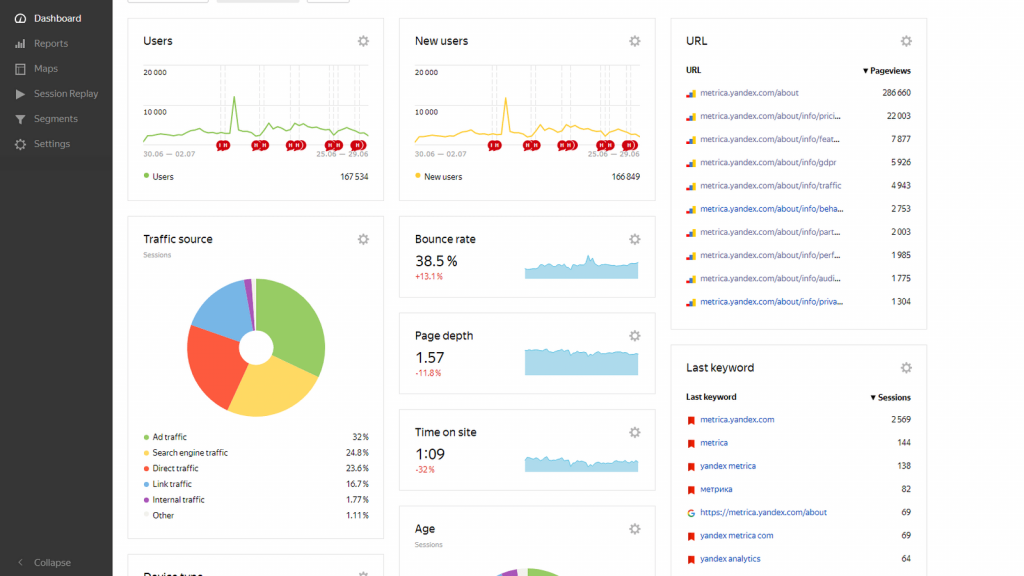
The dashboard of Yandex Metrica
Yandex Metrica presents a very intuitive operation. Its dashboard provides a comprehensive overview of information about the website.
The dashboard among the information proposes:
- Total users
- New users on the site
- Traffic origins
- The average age of visitors
- Devices used to navigate
- Average age of users
- The various sources of traffic
- Data on visits: dwell times, bounce rate, behavior on pages
Yandex Metrics also is easily customizable in the way it offers information. In fact, we can add preset or tailor-made boxes (widgets) to bring useful information to our case. The information then can be made gradually more detailed according to the degree of specificity our analysis needs.
The information is generally saved for two weeks.
Yandex Metrica Maps
Click Map
The click map gives an idea of how successful the buttons on the site are at attracting attention and prompting users to use them. From this data we can deduce whether we should change them in terms of location or layout.
Link Map
This is a heat map that takes on warmer tones in areas where users click more and cooler tones in places where there is less interaction.
Scroll map
This map highlights the areas that receive the most attention: areas tending toward red are the most viewed and areas tending toward blue are where users linger the least. The further down users go to look for information (scrolling) the more it is a sign of interest in the content.
Form Analysis
Contact form analysis allows users to check how well contact forms and their fields work. It is represented through a conversion funnel and returns us data on conversions, form usage and submissions. This item gives us an idea of the site’s conversion rate using the forms.
Session Replay
Session Replay is a command that allows you to record in the form of an unlimited number of videos a user’s visit session on the site. To use it, one simply needs to click on the Play button. The tool returns us data on the origin of visits, country, activities on the site, duration, number of pages viewed, etc. The table columns can be modified to meet the user’s preferences. Before viewing the video, we can view the browser, device and search engine used, duration of browsing, and other useful data.
From the traffic analysis, divided by categories, we can analyze the user experience and understand whether it can be improved by acting on text or graphics.
In the dark column on the left we can click on Settings and set the user monitoring features. In addition, Yandex Metrica is a tool that does not violate privacy rules as regulated by the GDPR.
As you can see, Yandex Metrica is an important qualitative and quantitative analysis tool for analyzing site performance from the perspective of user satisfaction and engagement developed. However, Google Analytics is still the most widely used platform with the largest amount of information available, so giving up on it to focus only on the competitor can reduce to a disadvantage for us. Nothing prohibits us from using both!!!


+ There are no comments
Add yours